Gameplay Data Analysis
In this section, we will showcase various examples of data analysis techniques that can be applied to your imported gameplay data. Through practical examples and code snippets, we will cover a range of analysis tasks, including generating statistics, visualizations, and comparing different agent strategies.
Runnable Jupyter Notebook
See gg-analysis.ipynb for a fully functioning notebook that works with your local Redis instance.
Importing Gameplay Data
Several helper functions are included below to assist in capturing data from both the Redis key-value store and directly from the GIO servers. We use extensive caching to expedite the data loading process after the initial data pull from the GIO servers.
The process begins by obtaining a list of replay IDs (these are stored in Redis). These replay IDs are then used to fetch the corresponding game data from Redis, using the specific bot ID and replay ID combination. The retrieved data is then organized into a dataframe, which focuses on a particular bot ID and includes data from all replay IDs.
After creating the dataframe, the we demonstate the analysis process proceeds by analyzing the performance of the a bot across different quadrants, along with other simple evaluations.
%pip install redis matplotlib numpy pandas
# packages we use in our analysis process
import redis
import json
import os
import urllib.request
import pandas as pd
from gior import gior

# The following (optional) packages were used to analyze the gameplay data.
import matplotlib.pyplot as plt
import numpy as np
Helper Functions
Code Block
The following code block contains the helper functions used to retrieve and format the gameplay datasets.
def __separate_turn_by_turn_data__(scores_list, playerIndex):
    armies = []
    land = []
    armies_enemy = []
    land_enemy = []
    victory = False

    # Iterate through each turn's scores
    for turn_data in scores_list:
        turn_data_decoded = json.loads(turn_data.decode())

        # Iterate through each player's data in the turn
        for player_data in turn_data_decoded:
            if player_data["dead"]:
                victory = player_data["i"] != playerIndex

                # Append data to the respective lists based on player index
            if player_data["i"] == playerIndex:
                armies.append(player_data["total"])
                land.append(player_data["tiles"])
            else:
                armies_enemy.append(player_data["total"])
                land_enemy.append(player_data["tiles"])

                # Return the separated data
    return armies, land, armies_enemy, land_enemy, victory


def __fetch_from_redis__(botId, replay_id):

    FILE_REDIS = f"./cache/{botId}-{replay_id}.json"

    # Check local cache first
    if os.path.exists(FILE_REDIS):
        with open(FILE_REDIS, "r") as f:
            return json.load(f)

    # Fetch data from Redis
    response = r.hgetall(f"{botId}-{replay_id}")

    # If response is empty, return None
    if not response:
        return None

    data = {}

    # Iterate through the response items and decode and store the data
    for key, value in response.items():
        key_str = key.decode()
        data[key_str] = json.loads(value.decode())

    # Fetch scores and separate the turn-by-turn data
    scores_raw = r.lrange(f"{botId}-{replay_id}-scores", 0, -1)
    (
        data["armies_self"],
        data["land_self"],
        data["armies_enemy"],
        data["land_enemy"],
        data["victory"],
    ) = __separate_turn_by_turn_data__(scores_raw, data["playerIndex"])
    maxArmyOnTile = r.lrange(f"{botId}-{replay_id}-maxArmyOnTile", 0, -1)
    moveCount = r.lrange(f"{botId}-{replay_id}-moveCount", 0, -1)
    data["maxArmyOnTile"] = [json.loads(item.decode()) for item in maxArmyOnTile]
    data["moveCount"] = [json.loads(item.decode()) for item in moveCount]

    # Store the fetched data in the cache
    with open(FILE_REDIS, "w") as f:
        json.dump(data, f)

    return data


def __fetch_from_server__(replay_id):

    URL_NA = f"https://generalsio-replays-na.s3.amazonaws.com/{replay_id}.gior"
    URL_BOT = f"https://generalsio-replays-bot.s3.amazonaws.com/{replay_id}.gior"
    FILE_GIOR = f"./cache/gio-{replay_id}.gior"
    FILE_JSON = f"./cache/gio-{replay_id}.json"

    # If the JSON file exists, return its contents
    if os.path.isfile(FILE_JSON):
        with open(FILE_JSON, "r") as f:
            return json.load(f)

    # If the GIOR file does not exist, download it
    if not os.path.isfile(FILE_GIOR):
        try:
            try:
                # Attempt to download the GIOR file from the NA server URL
                urllib.request.urlretrieve(URL_NA, FILE_GIOR)
            except:
                # If the NA server download fails, try the BOT server URL
                urllib.request.urlretrieve(URL_BOT, FILE_GIOR)
        except:
            return None

            # If the GIOR file still does not exist, return None
    if not os.path.isfile(FILE_GIOR):
        return None

    data = gior.deserialize(FILE_GIOR)

    # Cache the data to the JSON file
    with open(FILE_JSON, "w") as f:
        json.dump(data, f)

    return data


def getQuadrant(location, width, height):
    x = location % width
    y = location // width

    quadrant = 0
    if y > height / 2:
        quadrant += 2
    if x > width / 2:
        quadrant += 1

    return quadrant

# This is the main function used to collect data from Redis and the GIO servers.
# you can see we created custom columns in our dataset (e.g., using the getQuadrant
# method). You can customize this to fit your data needs.
def fetch_data(botId, replay_id):

    data = __fetch_from_redis__(botId, replay_id)

    if data is None:
        return None

    serverData = __fetch_from_server__(replay_id)

    if serverData is None:
        return None

    # Update additional data in the fetched data
    data["enemyGeneralLocated"] = data["enemyGeneral"] != -1
    data["totalMoves"] = data["moveCount"][-1]
    data["maxArmyOnTileEver"] = max(data["maxArmyOnTile"])

    # Update enemy general information from the server data
    enemyIndex = 1 - data["playerIndex"]
    data["enemyGeneral"] = serverData["generals"][enemyIndex]

    # Calculate own and enemy quadrant based on general locations
    data["ownQuadrant"] = getQuadrant(data["ownGeneral"], data["width"], data["height"])
    data["enemyQuadrant"] = getQuadrant(data["enemyGeneral"], data["width"], data["height"])

    return data

# This function reads data from Redis and the GIO servers and returns it as a pandas dataframe.
def generateDataFrame(botId):

    # Retrieve all unique replay IDs from Redis
    replay_ids = [x.decode('utf-8').replace('"','') for x in r.lrange(botId + '-replays', 0, -1)]

    # Fetch data from for each replay_id and store in a list
    data_list = [fetch_data(botId, replay_id) for replay_id in replay_ids]

    # Convert the list of dictionaries to a pandas DataFrame
    df = pd.DataFrame(data_list)

    # We chose to drop the columns that we ignored during our analsis.
    df = df.drop(columns=[
        'chat_room', 'options', 'game_type', 'lights', 'swamps',
        'playerColors', 'usernames', 'cities', 'ownTiles',
        'enemyTiles', 'teams', 'armies', 'terrain', 'discoveredTiles'
        ], errors='ignore')

    return df
The following code block will create a reference to the Redis instance running in the Docker container.
# Create a Redis client to connect to the local Redis server instance

r = redis.Redis(
    host="localhost",
    port=6379,
    db = 0
)

# Ensure cache directory exists
if not os.path.exists("./cache"):
    os.makedirs("./cache")
You can obtain your botId from Commander Cortex: It is an alphanumeric code printed in the upper right corner of the status block. It always starts with cortex-. This unique identifier is used to retrieve gameplay data from Redis and/or the GIO servers.
botId = 'cortex-796tP1U' # Update this to match the Bot ID in Commander Cortex!

df = generateDataFrame(botId)

df.info()
<class 'pandas.core.frame.DataFrame'>
RangeIndex: 13 entries, 0 to 12
Data columns (total 20 columns):
 #   Column               Non-Null Count  Dtype
---  ------               --------------  -----
 0   width                13 non-null     int64
 1   playerIndex          13 non-null     int64
 2   height               13 non-null     int64
 3   size                 13 non-null     int64
 4   replay_id            13 non-null     object
 5   turn                 13 non-null     int64
 6   enemyGeneral         13 non-null     int64
 7   ownGeneral           13 non-null     int64
 8   armies_self          13 non-null     object
 9   land_self            13 non-null     object
 10  armies_enemy         13 non-null     object
 11  land_enemy           13 non-null     object
 12  victory              13 non-null     bool
 13  maxArmyOnTile        13 non-null     object
 14  moveCount            13 non-null     object
 15  enemyGeneralLocated  13 non-null     bool
 16  totalMoves           13 non-null     int64
 17  maxArmyOnTileEver    13 non-null     int64
 18  ownQuadrant          13 non-null     int64
 19  enemyQuadrant        13 non-null     int64
dtypes: bool(2), int64(11), object(7)
memory usage: 2.0+ KB
Data Analysis Examples
In this section, we will provide an overview of the structure of the data collected using the GG framework and explain its key components. While the focus of this tutorial is not on performing extensive data analysis, understanding the structure of the data is crucial for effectively interpreting and utilizing it. By gaining insights into the data structure, you will be able to navigate and extract relevant information to evaluate your agent's performance and make informed decisions for further improvements.
Summary Statistics
First, we will compute some basic summary statistics and create simple visualizations.
df.describe().T
| count | mean | std | min | 25% | 50% | 75% | max | |
|---|---|---|---|---|---|---|---|---|
| width | 13.0 | 20.000000 | 1.683251 | 18.0 | 18.0 | 20.0 | 22.0 | 22.0 |
| playerIndex | 13.0 | 1.000000 | 0.000000 | 1.0 | 1.0 | 1.0 | 1.0 | 1.0 |
| height | 13.0 | 19.692308 | 1.702186 | 18.0 | 18.0 | 19.0 | 21.0 | 22.0 |
| size | 13.0 | 392.692308 | 35.933700 | 324.0 | 378.0 | 396.0 | 399.0 | 484.0 |
| turn | 13.0 | 241.923077 | 114.917696 | 93.0 | 152.0 | 198.0 | 325.0 | 490.0 |
| enemyGeneral | 13.0 | 161.538462 | 143.937264 | 0.0 | 32.0 | 118.0 | 306.0 | 392.0 |
| ownGeneral | 13.0 | 263.923077 | 123.036215 | 1.0 | 176.0 | 275.0 | 362.0 | 426.0 |
| totalMoves | 13.0 | 526.769231 | 277.846527 | 168.0 | 295.0 | 460.0 | 754.0 | 952.0 |
| maxArmyOnTileEver | 13.0 | 55.538462 | 36.335509 | 14.0 | 22.0 | 54.0 | 71.0 | 135.0 |
| ownQuadrant | 13.0 | 1.769231 | 1.165751 | 0.0 | 1.0 | 2.0 | 3.0 | 3.0 |
| enemyQuadrant | 13.0 | 1.076923 | 0.954074 | 0.0 | 0.0 | 1.0 | 2.0 | 3.0 |
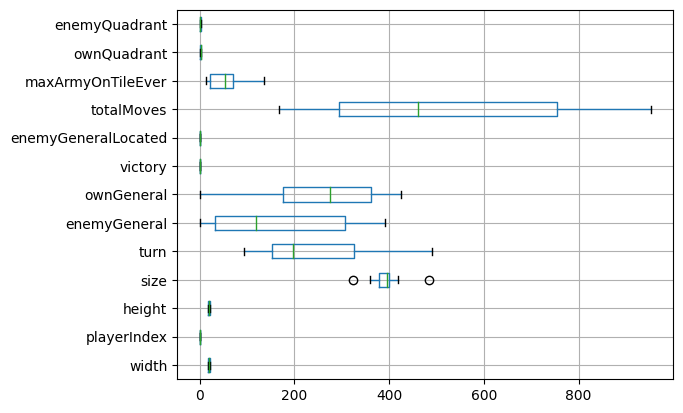
df.boxplot(vert=False)
plt.show()
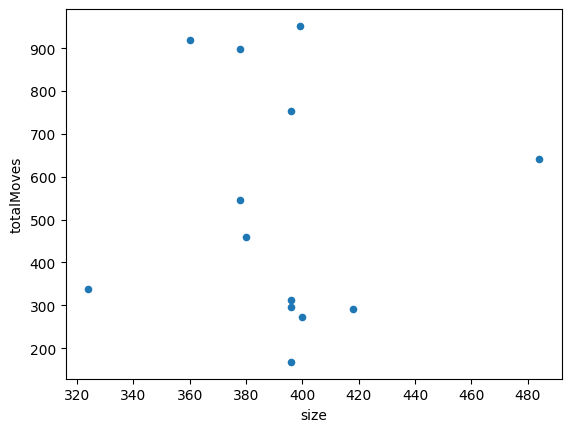
# One point in for each game played
df.plot(kind = 'scatter', x='size', y='totalMoves')
plt.show()
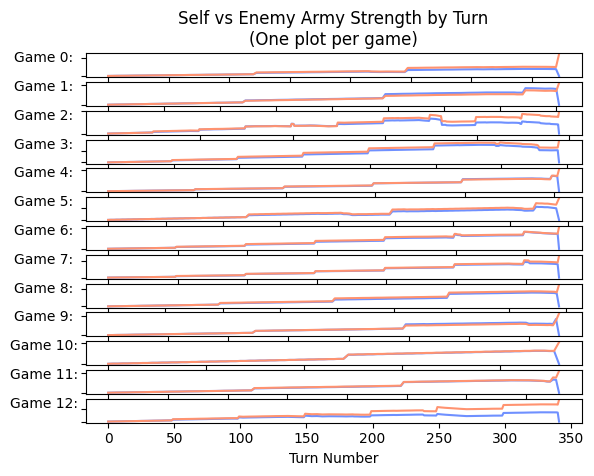
Displaying turn-by-turn data
Several columns include turn-by-turn data (see Table 1 from the paper). By unrolling these columns, we can analyze the trajectory of the capture data throughout a single game or across many games. The following plots show how this turn-by-turn data can be displayed quickly to gain interesting insights. These should serve as a starting point for further analysis.
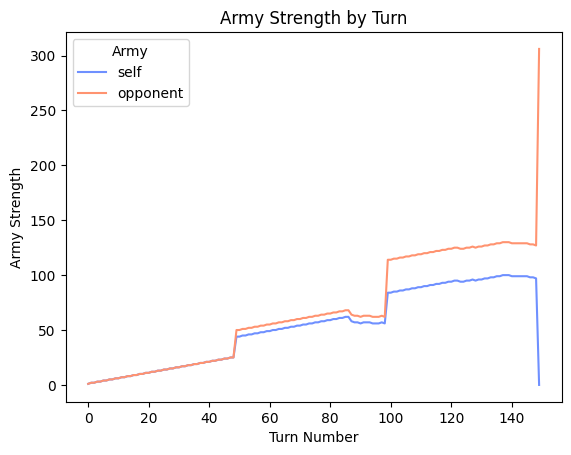
def compare_army_strengths_by_turn_single_plot(game_index):
    f, ax = plt.subplots()
    ax.plot(df['armies_self'][game_index], color = '#6F90FF',label='self')
    ax.plot(df['armies_enemy'][game_index], color = '#FF9370', label='opponent')
    ax.set_title('Army Strength by Turn')
    ax.set_xlabel('Turn Number')
    ax.set_ylabel('Army Strength')
    ax.legend(loc='upper left', title='Army')
    plt.show()

compare_army_strengths_by_turn_single_plot(game_index = 0)
def compare_army_strengths_by_turn_separated():

    f, ax = plt.subplots(len(df))

    # Add one line plot for each game played
    for i in range(len(df)):
        ax[i].plot(df['armies_self'][i], color = '#6F90FF')
        ax[i].plot(df['armies_enemy'][i], color = '#FF9370')
        ax[i].set_yticklabels([]) #
        ax[i].set_ylabel(f'Game {i}:            ', rotation=0)

    ax[0].set_title('Self vs Enemy Army Strength by Turn\n(One plot per game)')
    ax[len(df)-1].set_xlabel('Turn Number')
    plt.show()

compare_army_strengths_by_turn_separated()